The easiest way to find out price movements or changes is to use a Chart Pattern. If you are a beginner trader, you must know all about how to read forex chart patterns here.
Charts or charts are also very useful for determining trends or determining the upper and lower limits of a price movement that occurs in order to create profit opportunities to be achieved.
Here we will discuss the types of charts/graphs. Because all forex trading activities can not be separated from the Chart Pattern.
- Line Chart
- Bar Chart
- Candlesticks
The most often used is the type of forex candle graph, so a more detailed explanation of candlesticks will be discussed, although other charts will also be reviewed to add insight.
This is important because the more we know, the more we will be able to do something.
Also read: Forex Price Movements: Pivot Points, Support and Resistance
How To Read Forex Chart Patterns
Line Chart
As the name implies, this chart or chart is in the form of a line, according to my observations it is very rare for traders to analyze with this type of chart.
Bar Chart
This type of chart is similar to the type of candle, but because of its thin shape, it is quite difficult for traders to analyze with this type of chart.
Moreover, the down bar and the up bar are almost the same. Just like the line chart I rarely see traders use this chart in analyzing, here is the bar chart display.
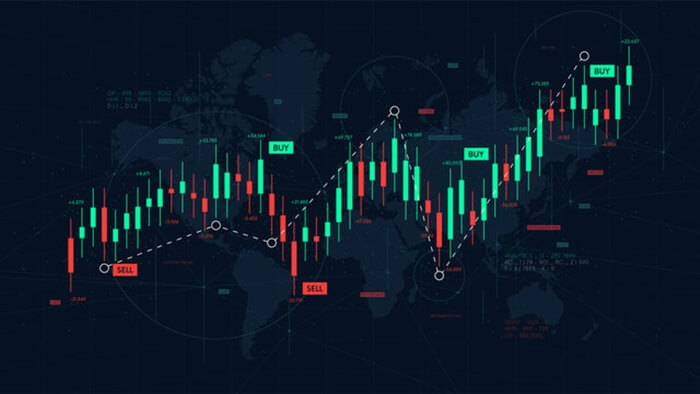
Candlestick
We will discuss this type of chart in more detail because traders generally use this chart type in predicting and analyzing price movements.
It is called a candlestick because it looks like a candle. The full name is a Japanese candlestick chart.
Candlestick charts were first used in Japan in the 17th century, used to track the movement of rice prices in that country.
After experiencing many variations, candlestick finally became the most widely used chart in the world of trading both in stocks and forex.
If the price rises or the closing price is higher than the opening price, the candlestick will be white, another name is “Bullish Candle”. In addition to the white color, the Bullish Candle is also depicted in green or blue.
Meanwhile, if the closing price is lower than the opening price, then the Candlesticks will be in the curtain or black, another name is ‘Bearish Candle’ depiction of Bearish Candle also some use red.
Also read: What is Forex Trendline Analysis
The distance between the lowest opening price or closing price and the lowest price is called the “lower shadow”. While the distance between the highest price and the highest opening or closing price is called the ‘upper shadow’.
Well, that’s a bit of a simple discussion about learning how to read forex pattern charts for beginner traders, find all forex knowledge only at ForexPsychology.com for free.